
📈 Liquidity is the silent force of the market—when the Reserve Bank of India tightens it, discipline rises; when it loosens it, growth begins to flow


Most traders focus on charts, patterns, and indicators. That’s fine—but incomplete. If you ignore liquidity, you’re trading blind. Because behind every rally, crash, breakout, or sideways move, there’s one invisible force driving everything: 👉 Money flow controlled by the Reserve Bank of India (RBI). This is where serious traders separate themselves from noise.
📊 What Is Market Liquidity (Simple but Powerful)
Market liquidity = availability of money in the system. High liquidity → Easy money → Markets rise. Low liquidity → Tight money → Markets struggle. 👉 Think of liquidity like fuel: More fuel = faster market, Less fuel = stalled market.
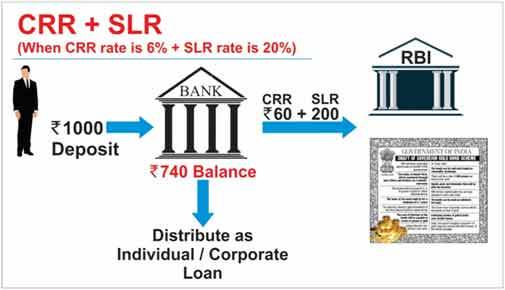
⚙️ How RBI Controls Liquidity (Core Mechanisms)


🧠 The Real Game: Liquidity Cycles
RBI operates in cycles:
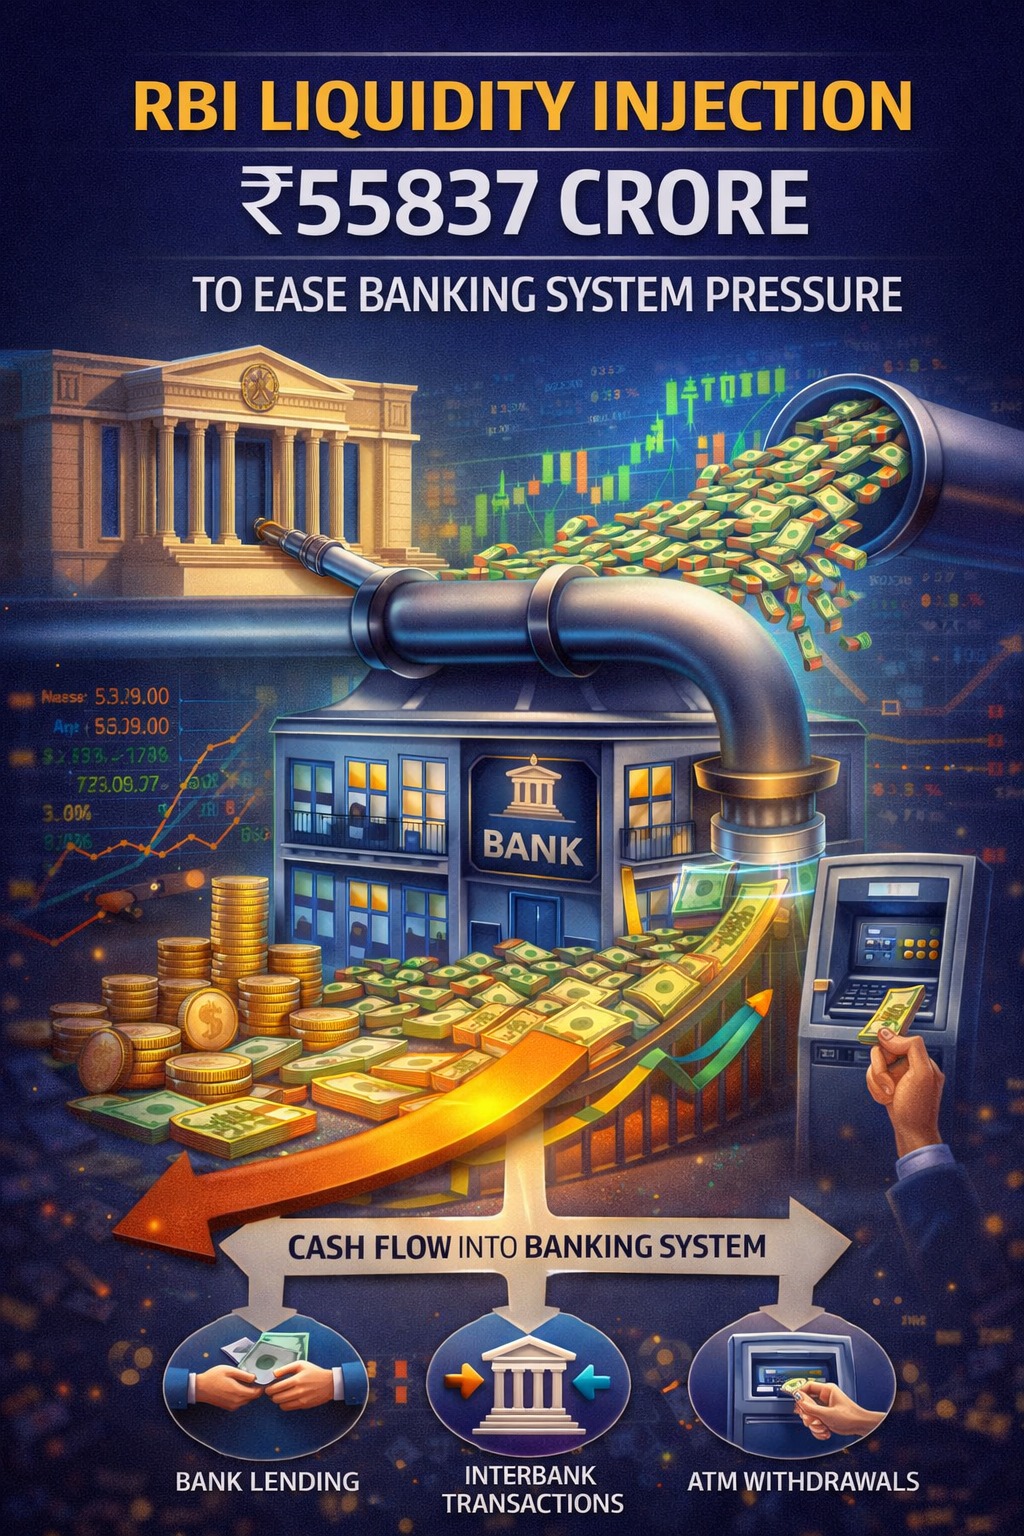
- 🔄 Expansion Phase: Lower rates, reduce CRR, inject liquidity → Markets rally, risk-taking increases.
- 🔄 Tightening Phase: Increase rates, increase CRR, absorb liquidity → Markets slow or fall, risk reduces.
📉 Why Traders MUST Care (No Excuses)
- 🔥 1. Liquidity Drives Trends — Bull markets = liquidity expansion, bear markets = liquidity contraction.
- 🏦 2. Sector Rotation Starts Here — Banking sensitive to rates, real estate needs cheap loans, IT less impacted. Liquidity tells where money flows next.
- 📊 3. Volatility Comes from Liquidity Shifts — Sudden moves happen due to unexpected RBI action or tightening signals.
- 💡 4. Institutional Money Follows RBI — Big players follow policy direction. If RBI tightens, institutions reduce exposure; if eases, increase risk.

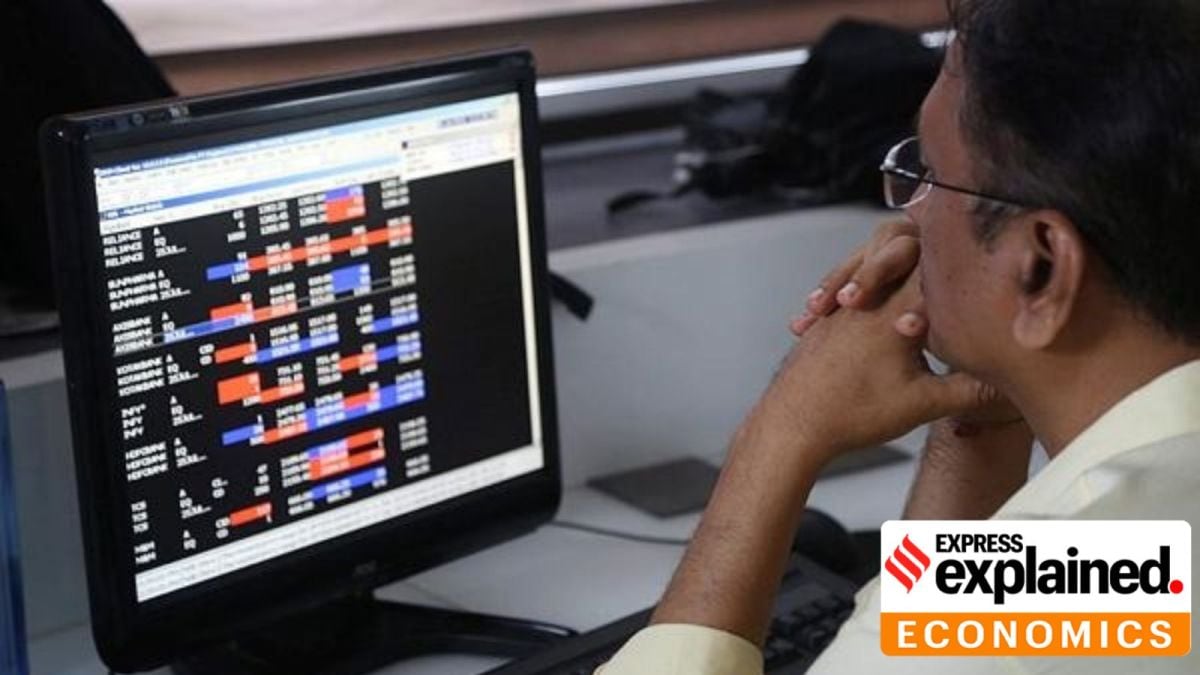

📈 Real Example Mindset: Average Trader vs Smart Trader
- ❌ Average Trader: Sees market falling, blames news, reacts late.
- ✅ Smart Trader: Tracks RBI liquidity signals, anticipates tightening, reduces exposure early.
👉 Same market, different outcome.
🧩 How to Use This Practically — No theory, real execution
✅ Step 1: Track RBI Policy Regularly
Focus on Repo rate, CRR / SLR, liquidity statements, and policy stance.
✅ Step 2: Identify Liquidity Direction
| Signal | Interpretation |
|---|---|
| Rate cuts + liquidity injection | Bullish |
| Rate hikes + liquidity absorption | Bearish |
| Neutral stance | Range-bound |
✅ Step 3: Align Your Strategy
- Bullish liquidity → Aggressive trades
- Tight liquidity → Defensive trades
- Uncertain → Reduce risk
🚀 Advanced Insight (Where You Gain Edge)
Markets move on expectation of liquidity, not just current liquidity. If RBI hints future tightening → market may fall early; future easing → market may rally early. Read between the lines, not just headlines.
📌 Final Takeaway
Liquidity is not optional knowledge. It is the backbone of market movement, the signal behind trends, the edge smart traders use. And RBI is the one controlling it.
🎯 Your Action Plan
Next RBI policy:
- Note changes (repo, stance, CRR)
- Identify liquidity direction
- Predict market move (Nifty/Bank Nifty/sectors)
- Compare outcome
Do this consistently → you’ll stop guessing and start understanding.