
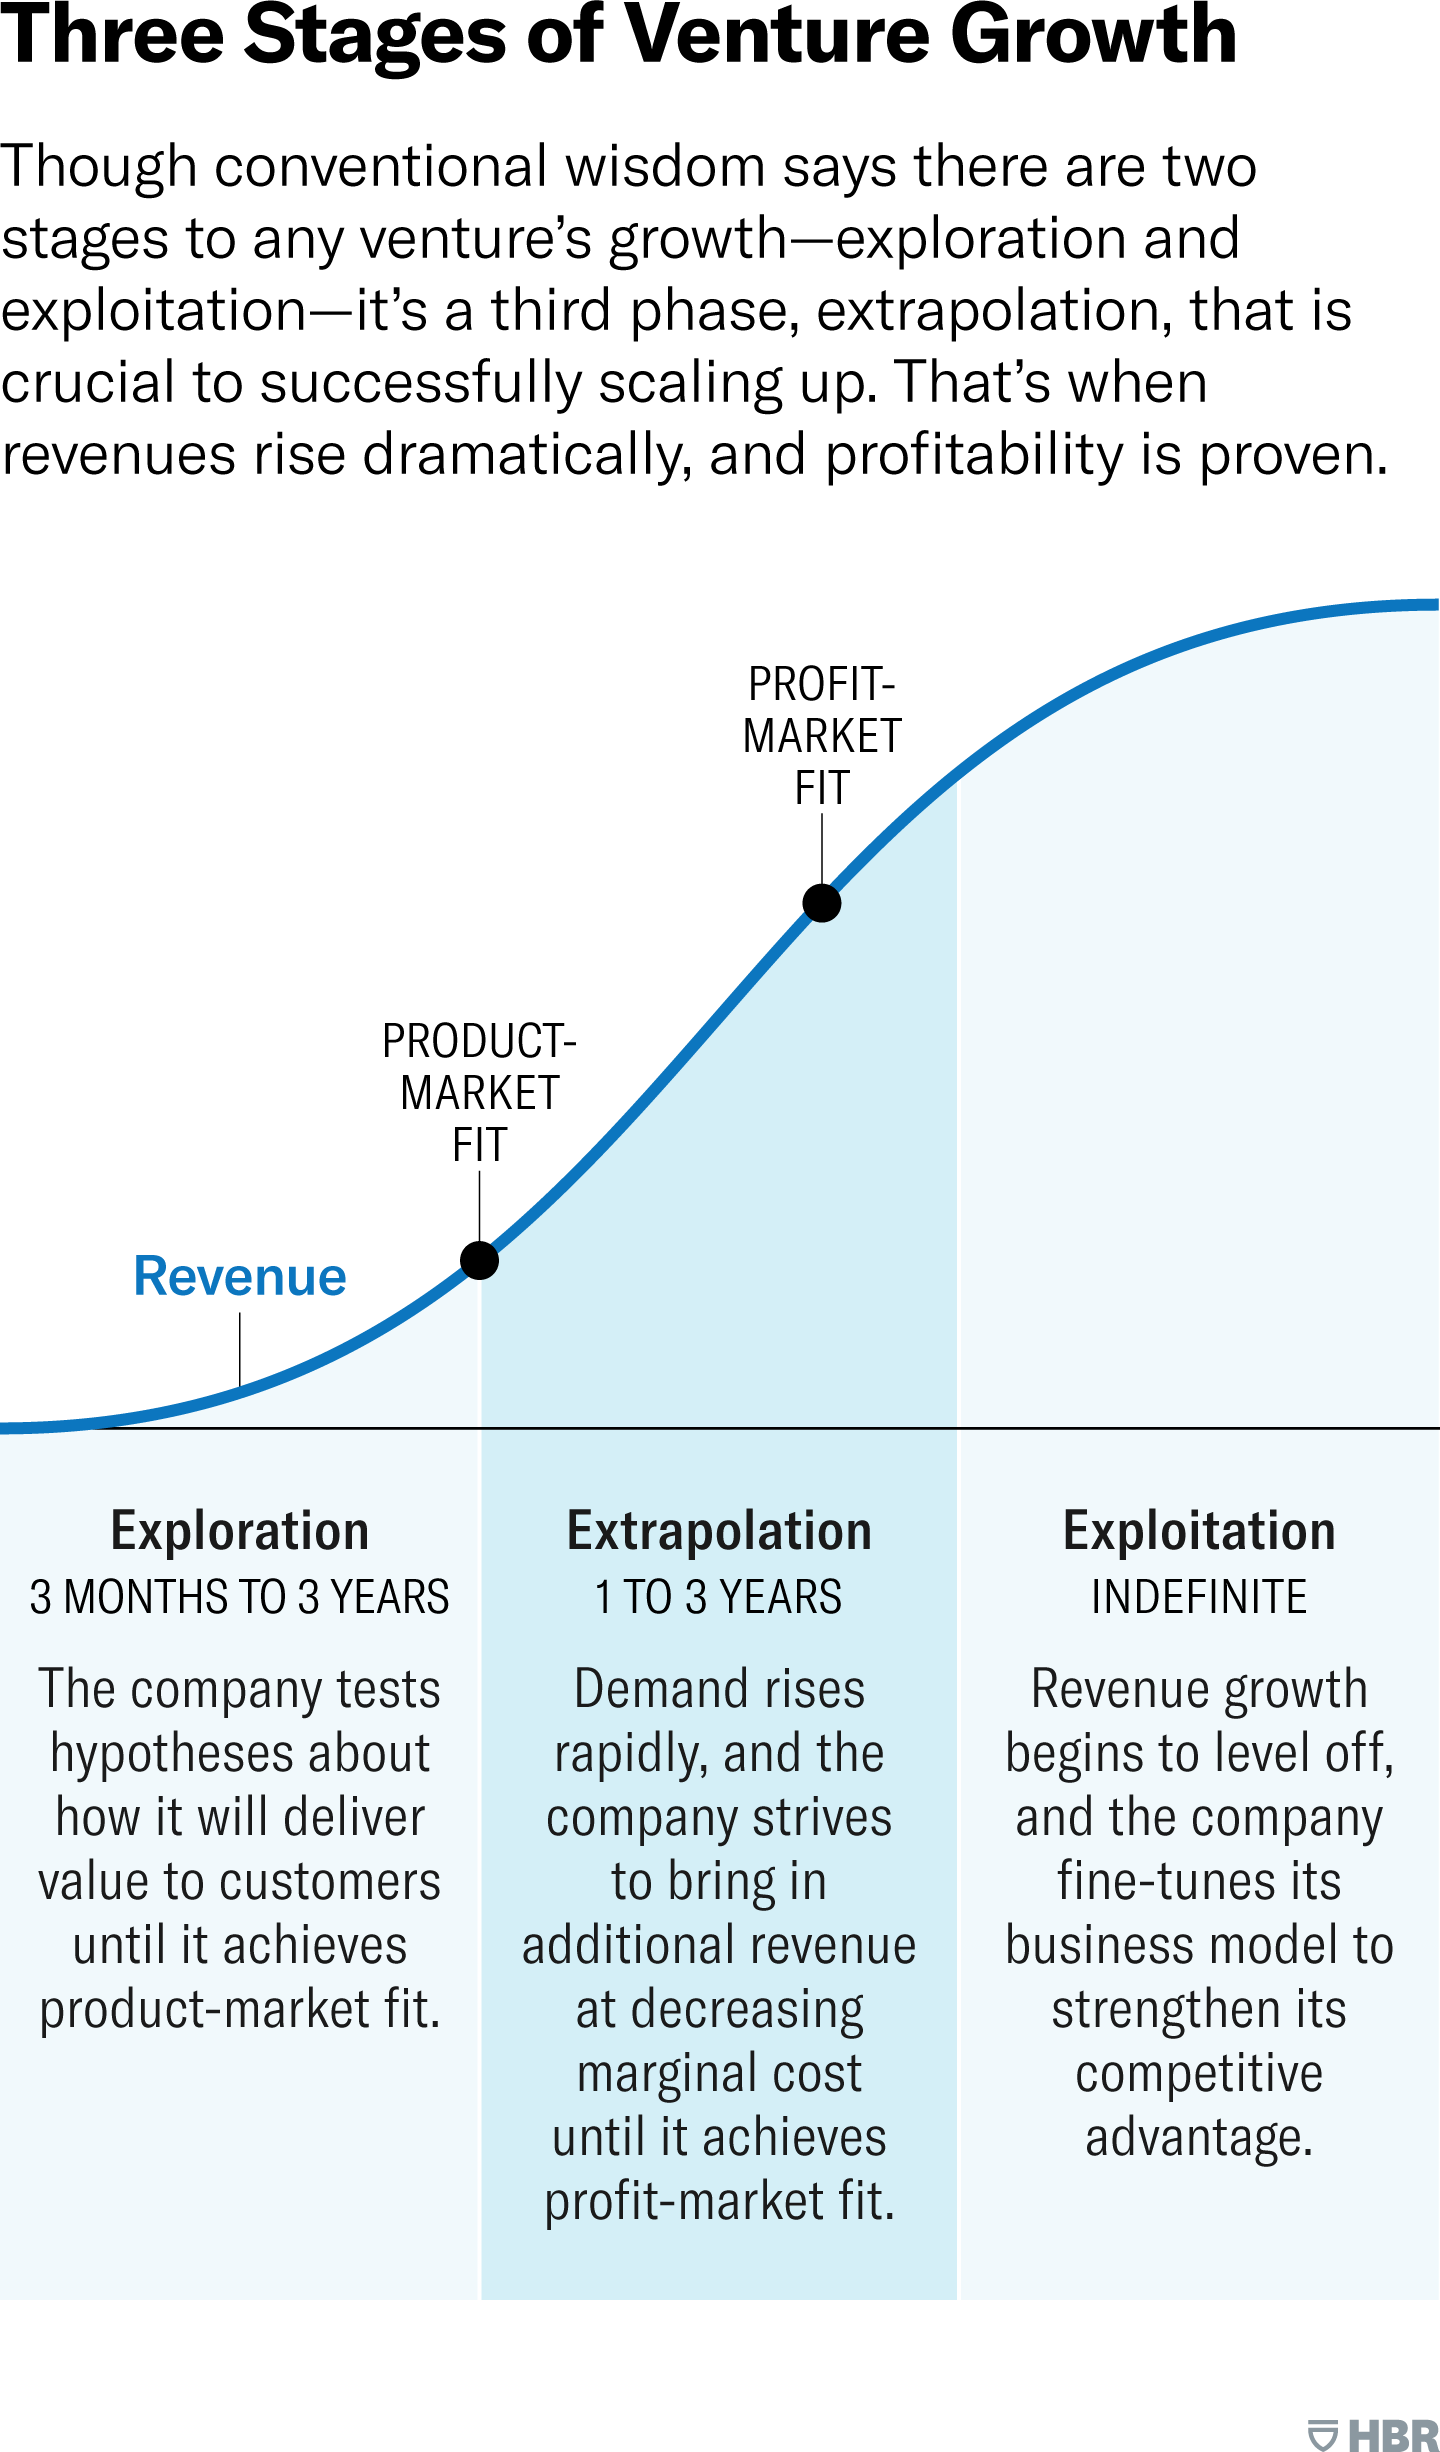
EBITDA shows how strong the business looks—net profit shows how strong it actually is
Most investors think they understand profit. They don’t. They see “Company posted ₹500 crore profit” or “EBITDA grew 30% YoY” …and assume the business is doing great. That’s surface-level thinking.
Smart investors ask a deeper question: 👉 “What kind of profit are we talking about—and what does it actually tell me?” Because not all profits are equal. This is where EBITDA vs Net Profit becomes critical.
🧠 First, Understand the Core Difference

EBITDA vs Net Income
Visual Difference
Income Deep Dive

Profit Margins
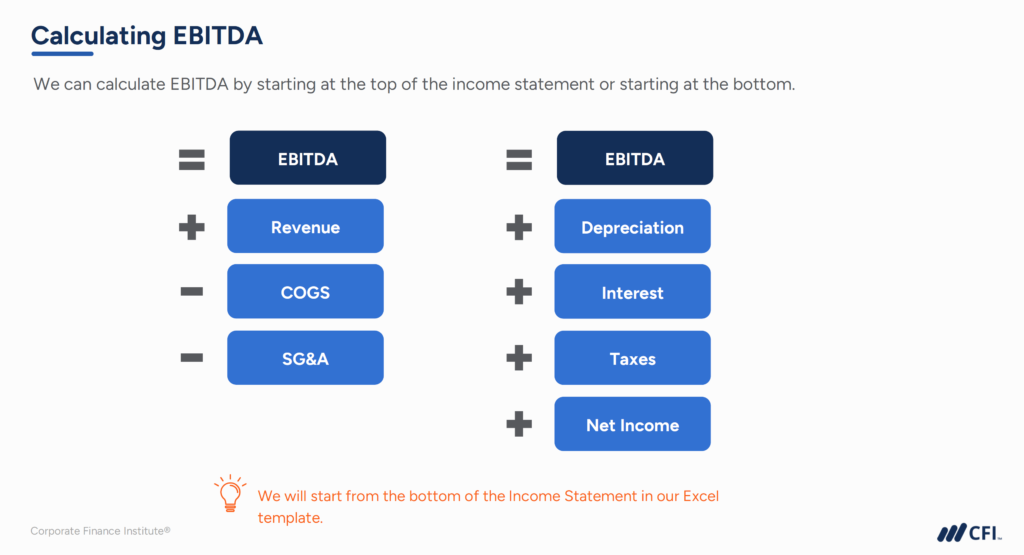
Tells you how profitable the core business operations are (before financial & accounting adjustments). Removes interest, taxes, depreciation & amortization.
📊 Net Profit (Bottom Line)
What’s actually left for shareholders after ALL expenses: interest, taxes, depreciation, and every cost the business faces.
⚡ Simple Analogy: Think of a business like a car: EBITDA = Engine performance | Net Profit = Final mileage after road conditions, fuel cost, and load. A powerful engine doesn’t guarantee good mileage.
🚨 Why Most Beginners Get This Wrong
They see high EBITDA → assume strong business, ignore net profit → miss risks. Or they see low net profit → assume weak company, ignore EBITDA → miss growth potential. Both are incomplete.
📉 Breaking It Down: Where the Difference Comes From

Adjustments Overview
Depreciation Effect
Cost Structures
Profit Flow
1. Interest (Debt Cost): High debt → EBITDA may look strong, but interest eats profits → weak net profit.
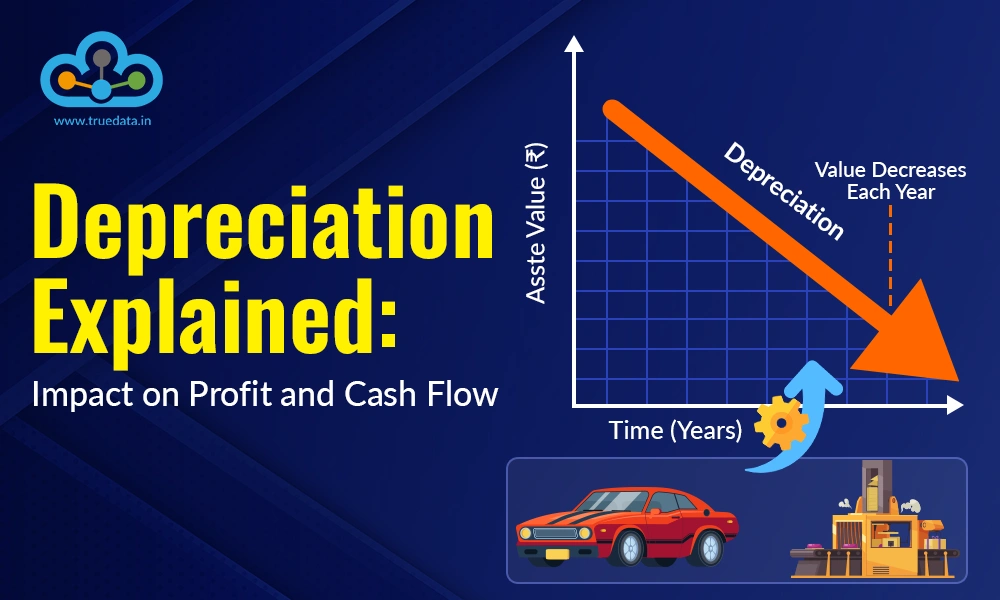
2. Depreciation: Capital-heavy businesses (manufacturing, telecom) → high depreciation → lower net profit, even if operations strong.
3. Taxes: Government share. Some companies show strong EBITDA but high tax burden.
📊 When EBITDA Matters More
High-Growth Signals

Capital Intensive

Turnaround Signs

Cash Flow Focus
🚀 High-Growth Companies: Investing heavily, profits temporarily suppressed. EBITDA helps see if core business works.
🏗️ Capital-Intensive Industries (Telecom, Infra, Airlines): huge assets, high depreciation — net profit looks low, but EBITDA shows operational strength.
📈 Turnaround Stories: Net profit weak, EBITDA improves first → early recovery signal.
📉 When Net Profit Matters More
Mature Stability
Business Lifecycle

Stability Metrics

Sustainable Profit
🧾 Mature Companies → should generate consistent net profit, not hide behind EBITDA.
⚠️ High Debt Companies: strong EBITDA but weak net profit because interest kills earnings.
💸 Dividend Investors: dividends come from net profit (not EBITDA).
🔥 The Real Trick Smart Investors Use
They don’t choose one. They compare both — the “Gap Analysis” Strategy. Look at EBITDA vs Net Profit gap.
✅ Small Gap = Healthy business (low debt, efficient operations, stable earnings).
⚠️ Large Gap = Warning sign (high debt, heavy depreciation, poor cost control).
That question alone can save you from bad investments.
📊 Real-World Style Interpretation
Company A: EBITDA ₹1000cr | Net Profit ₹800cr → Strong, efficient, low leakages.
Company B: EBITDA ₹1000cr | Net Profit ₹200cr → Something wrong: high debt? high depreciation? tax issues?
❌ Trap 1: “EBITDA is Everything” – Some companies promote EBITDA heavily because net profit looks weak.
❌ Trap 2: Ignoring Industry Context – Compare within same industry.
❌ Trap 3: Blind Ratio Analysis – Always ask “Why is this number high or low?”
🧠 A Simple Framework You Can Use
✅ Step 2: Check Net Profit Trend (consistent growth? sudden drops?)
✅ Step 3: Analyze the Gap (small = strong, large = investigate)
✅ Step 4: Understand the Reason (Debt? Depreciation? Taxes?)
✅ Step 5: Compare with Peers (industry standard matters)
📈 Final Reality Check
If you only look at EBITDA → you may fall for hype. Only look at Net Profit → you may miss growth. Smart investing = understanding the relationship between both.
Enter any company name and test your understanding. Our smart analyzer applies the Gap Analysis strategy and tells you whether the business looks healthy or risky based on simulated financial logic.
🎯 Action Plan (Do This Now)
Don't just read this. Execute.
Step 1: Pick any company (Nifty 50).
Step 2: Find EBITDA & Net Profit.
Step 3: Ask why there's a gap.
Step 4: Write conclusion: Strong / Risky / Watchlist.
Do this for 5 companies. You’ll understand more than 90% of retail investors.
🧠 Final Thought
“Profit is not a number—it’s a story.” EBITDA tells you the beginning. Net profit tells you the ending. And smart investors always read the full story.