
📊 Smart investors don’t chase prices—they understand the numbers behind them
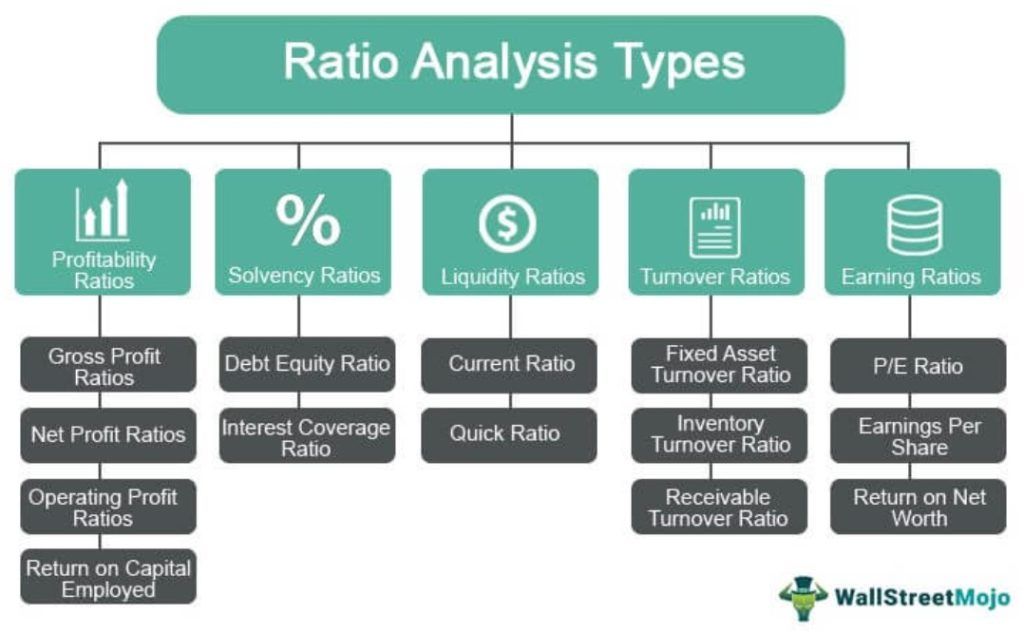
Smart investing starts with decoding numbers — master these ratios, build unshakable discipline.


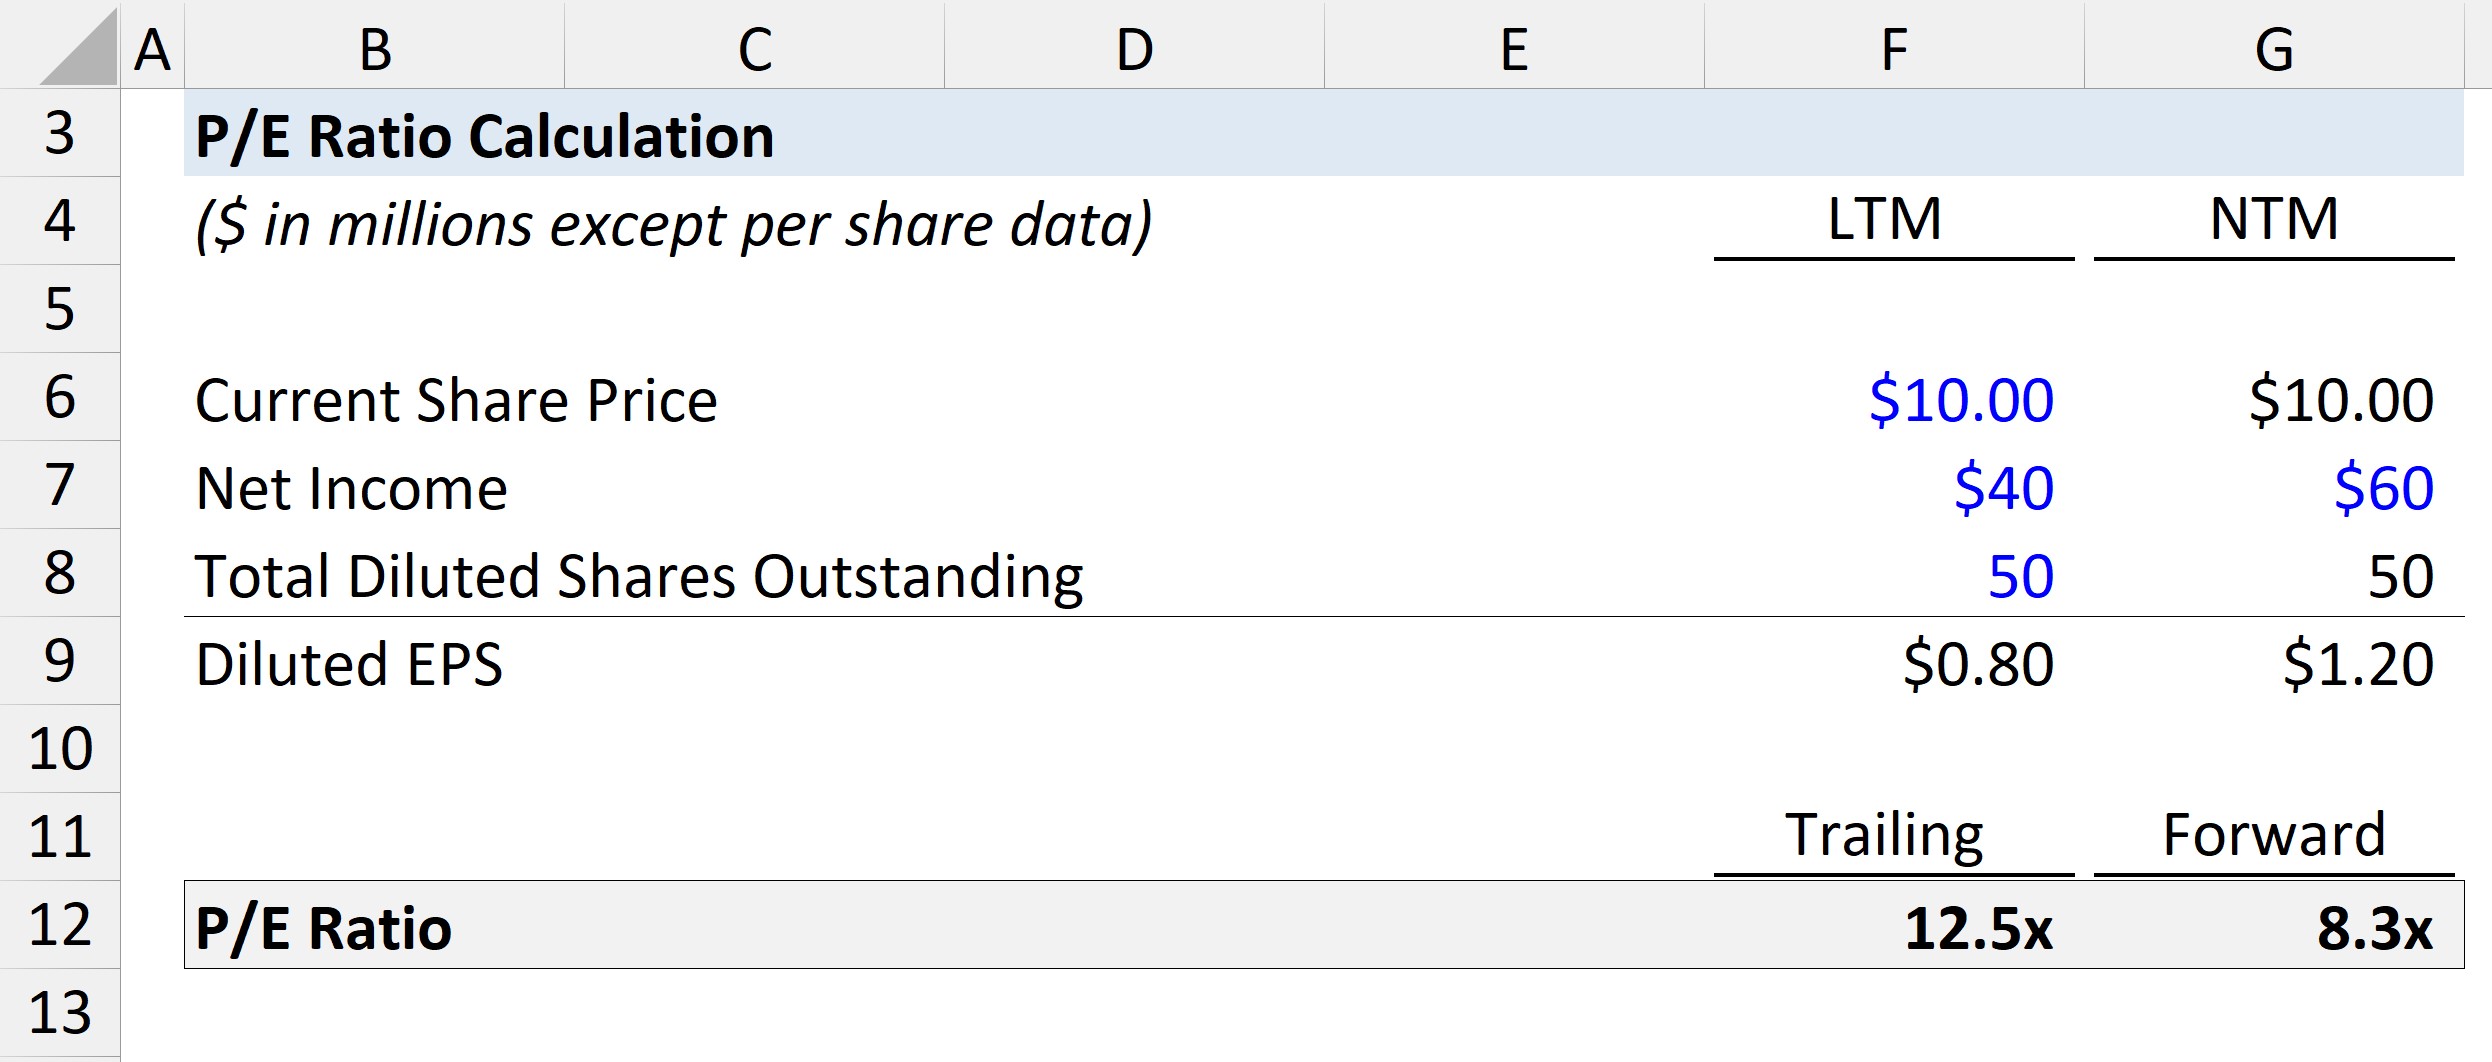
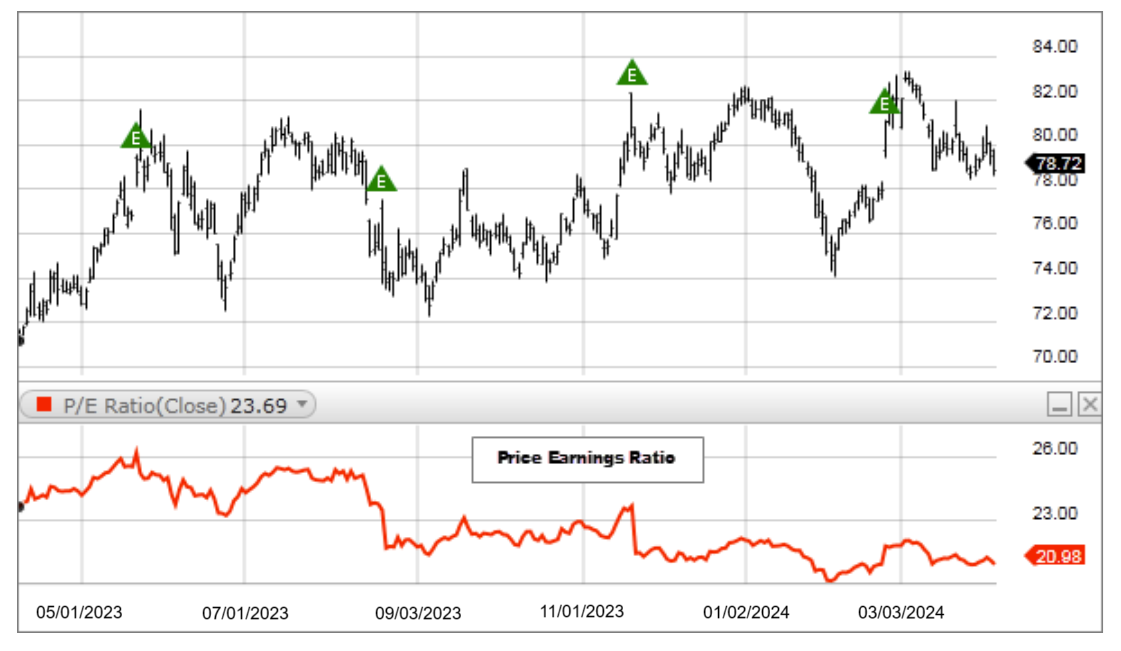
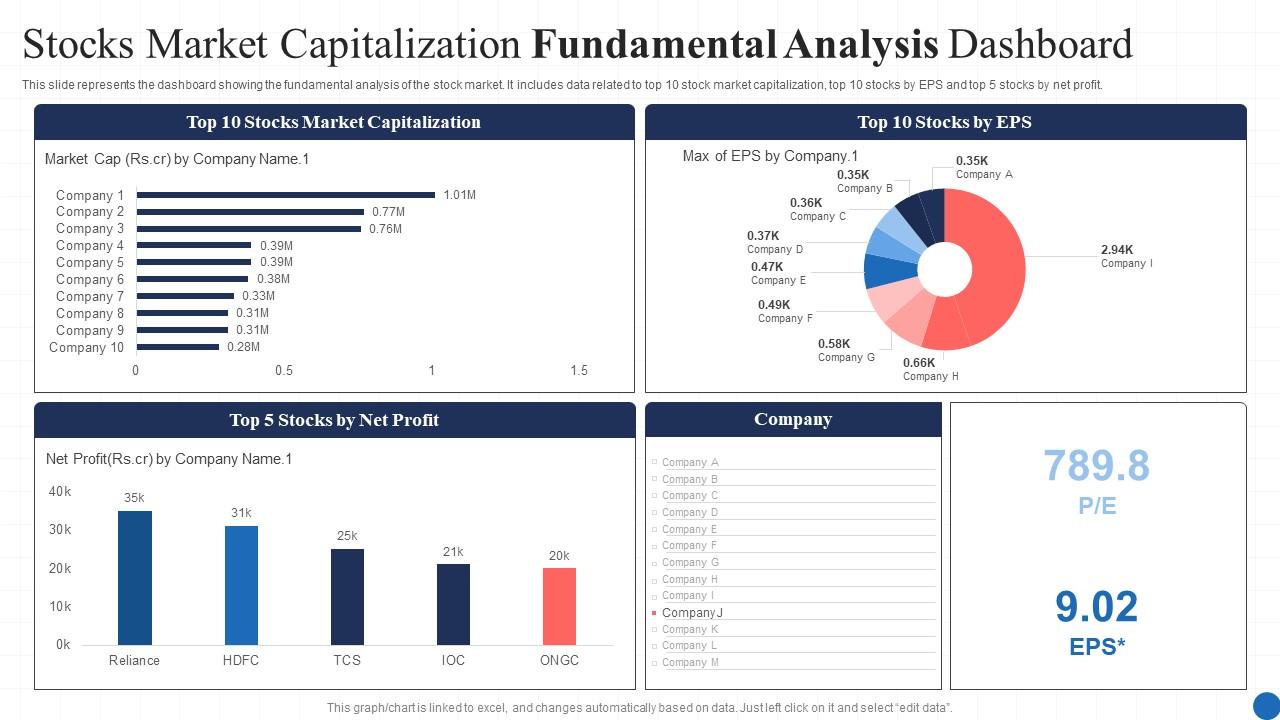
🧠 1. Price to Earnings Ratio (P/E)
📐 Market Expectation Meter
What it tells: How much investors pay for ₹1 of earnings. High P/E = growth expectations, low P/E = possible undervaluation.

💰 2. Price to Book Ratio (P/B)
📖 Net worth indicator
P/B under 1 suggests undervaluation; above 3 may signal overvaluation. Ideal for banks & asset-heavy firms.

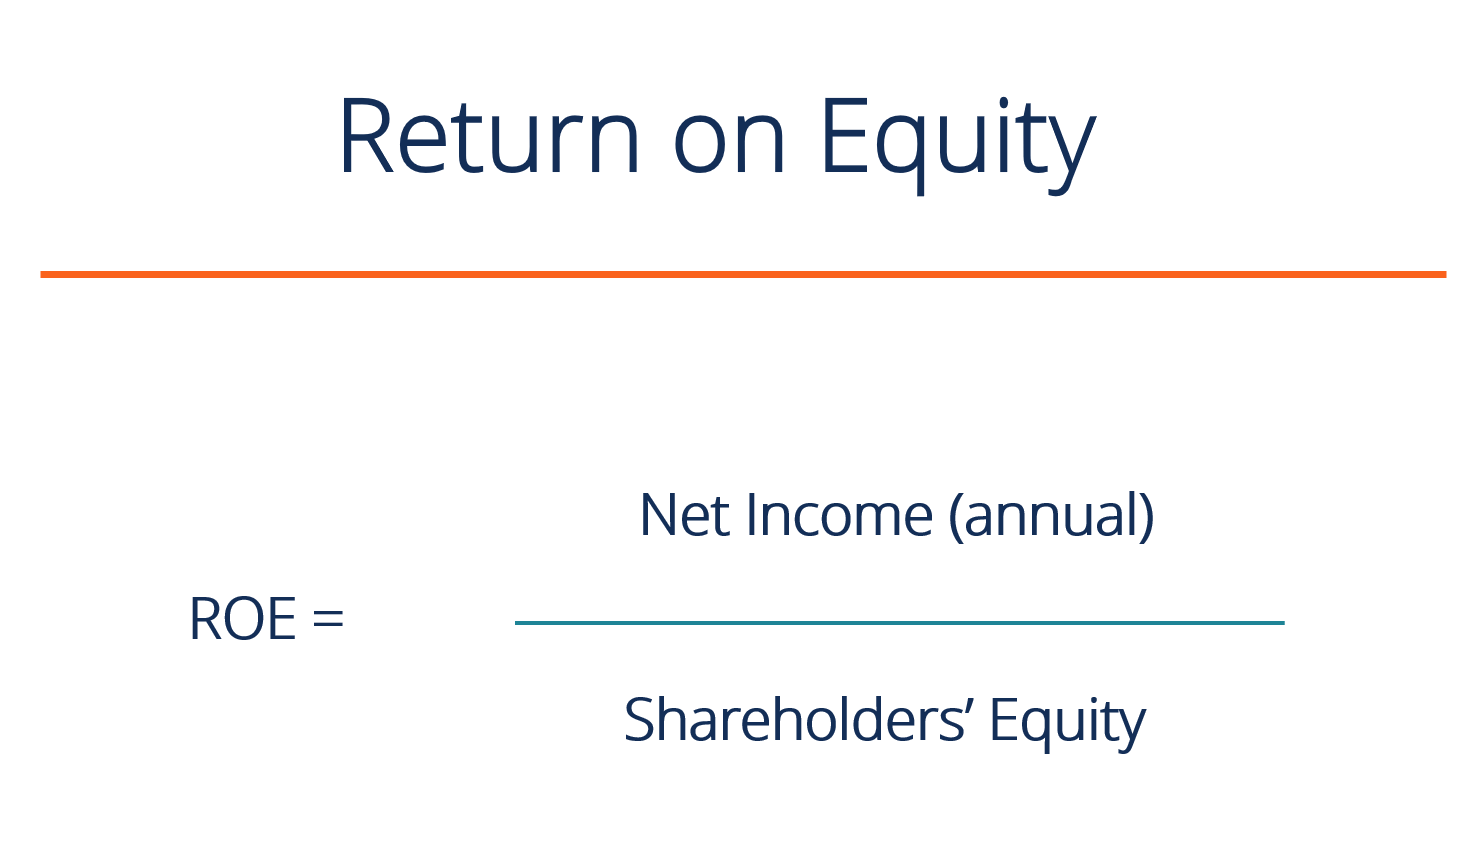
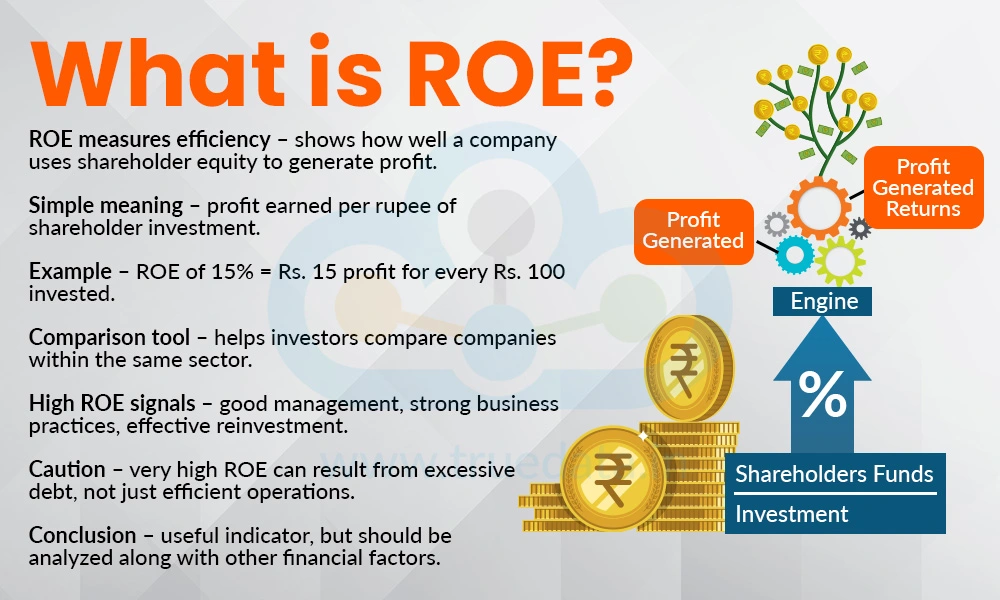
📈 3. Return on Equity (ROE)
🏆 Profitability powerhouse
Measures how efficiently company uses investor money. ROE > 15% strong, >20% excellent.

⚙️ 4. Return on Capital Employed (ROCE)
🏭 Total capital efficiency
High ROCE indicates wise capital allocation. Compare with industry peers.
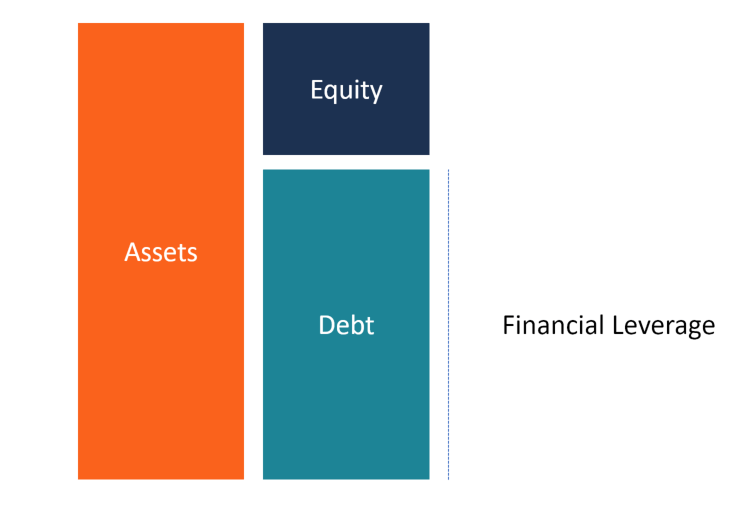
💸 5. Debt to Equity Ratio (D/E)
⚖️ Risk thermometer
D/E < 1 is safer; D/E > 2 signals high risk. Critical in downturns.

💵 6. Current Ratio
🩸 Short-term liquidity shield
Ideal range: 1.5 – 2. Below 1 → liquidity red flag. Too high might indicate inefficiency.
📊 7. Earnings Per Share (EPS)
📌 Per-share profit gauge
Rising EPS indicates consistent growth. Always track trend over multiple years.


🔄 8. Inventory Turnover Ratio
📦 Operational efficiency
High turnover = strong demand, lean inventory. Low turnover = weak sales or overstocking.
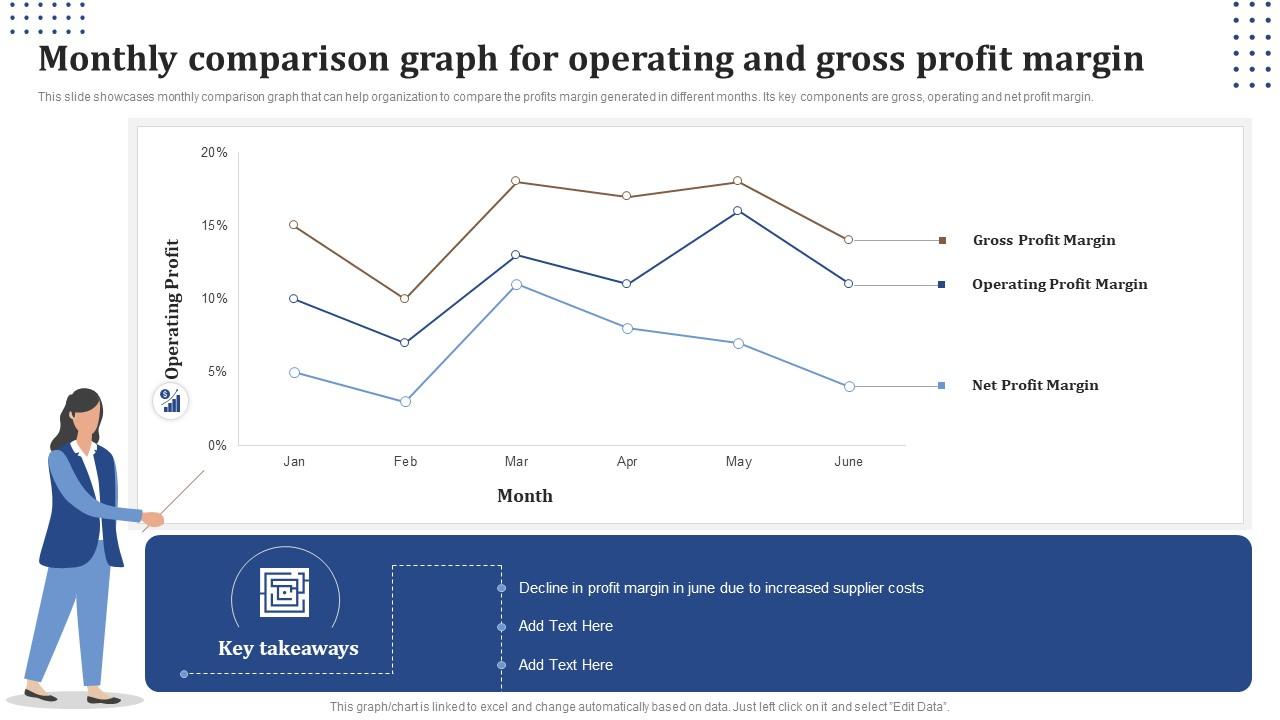
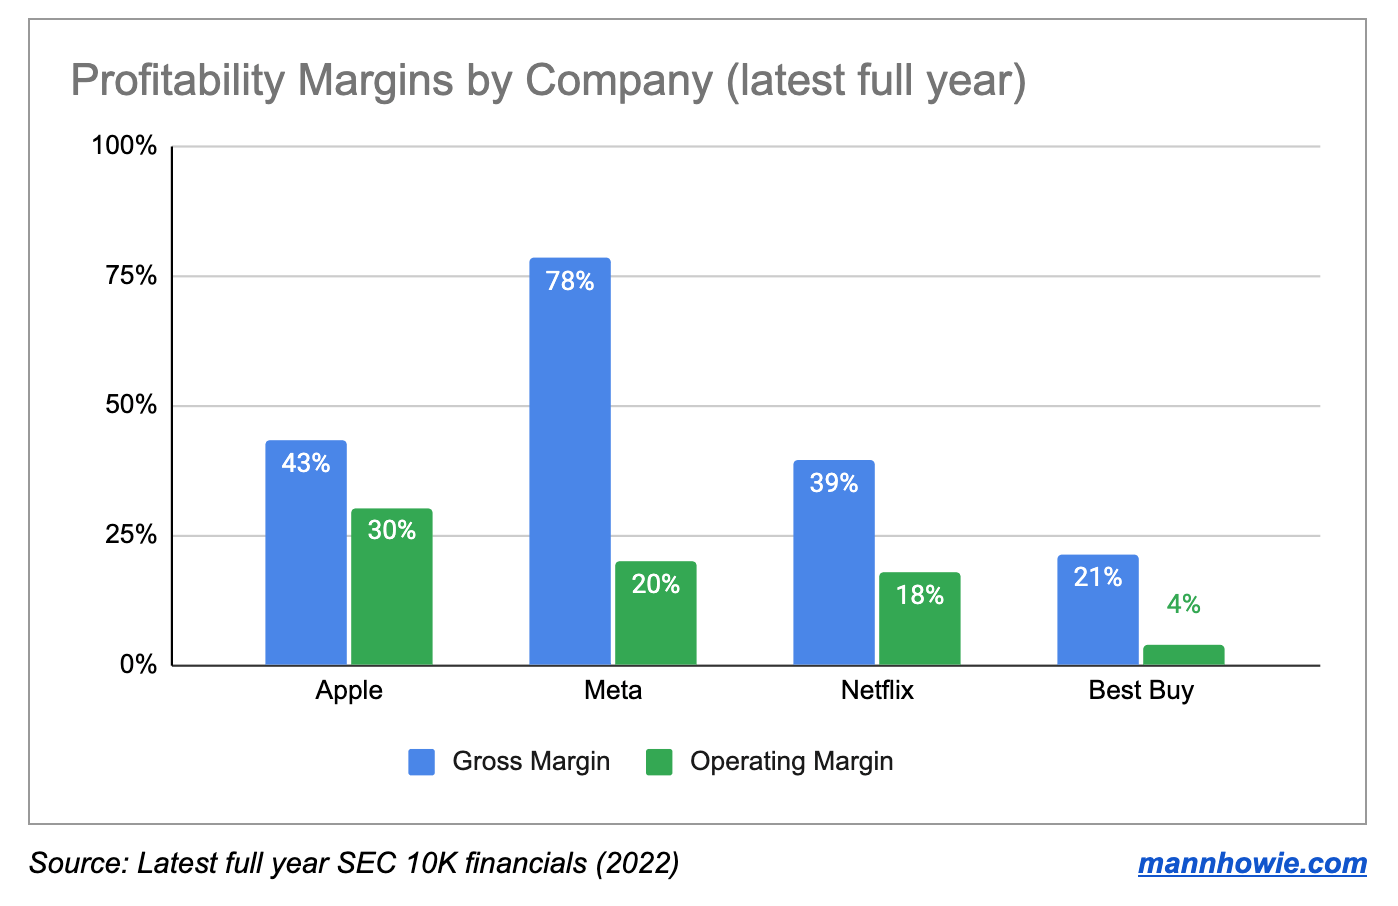
💹 9. Operating Profit Margin (OPM)
🔥 Core business profitability
Stable & high margins reveal competitive advantage and pricing power.
📉 10. Free Cash Flow (FCF)
💎 Real cash reality
Positive FCF = financial flexibility. Negative FCF may be okay in growth phase, but caution needed.
⚠️ Common Mistakes & Pro Framework
❌ Most beginners misuse ratios: ignoring industry context, looking at single ratio, no historical trend.
✅ 3-Step Winning Framework:
- Profitability Check: ROE, ROCE, OPM
- Valuation Check: P/E, P/B
- Risk Check: Debt/Equity, Current Ratio, Free Cash Flow
🇮🇳 India insight: Banking stocks → P/B & ROE focus; FMCG → OPM & brand strength; Infra → watch debt vigilantly.
🎯 Final Thoughts & Action Plan
🚀 Financial ratios won’t make you rich overnight — but they build discipline & protect capital.
✅ Start now: pick 1 company, calculate all 10 ratios, compare competitors, and write your own analysis. Do this for 30 days → your investing mindset will transform.
“Reading this changes nothing. Applying it changes everything.”
)